Biosolids production in Australia 2010 – 2023
The total biosolids production of Australia identified in the current survey is 372,000 tonnes per year of dry solids, representing about a 6% increase from the 2021 survey. The previous survey results are shown in the table below.
The average solids content of dewatered biosolids is around 23% (weighted average) and this equates to around 1.6 million tonnes of biosolids in dewatered form (also called wet biosolids) used in 2022/23.

Table: Annual Biosolids Production in Australia 2022/23
Biosolids end-use in Australia – 2023
In Australia, nearly 85% of biosolids is beneficially used, similar to 83% in 2021 but down from 91% in 2019.

Biosolids production in Australia 2010 – 2021
The total biosolids production of Australia identified in the ANZBP commissioned 2021 survey was about 349,000 tonnes per year of dry solids (also called dry tonnes). This compares to 300,000 tonnes in 2010, 330,000 tonnes in 2013, 310,000 in 2015, 327,000 in 2017 and 371,000 in 2019.
The average solids content of dewatered biosolids in the 2021 survey was around 25% (weighted average). Therefore, the total 2021 production in Australia equates to around 1.4 million tonnes of biosolids in dewatered form (also called wet tonnes).

Figure: Biosolids total production in Australia from 2010 to 2021
Biosolids end-use in Australia – 2021
In Australia, about 83% of biosolids were beneficially used in 2021, down from 91% in 2019 and 94% in 2017. This change is due to the increase stockpiling of biosolids, particularly in Victoria (13% stockpiled in 2021 compared with 5% in 2019).
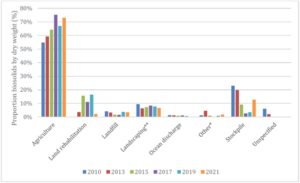
Figure: Biosolids end-use (dry mass basis) in Australia from 2010 to 2021
* Other includes Forestry
** Landscaping changed from landscaping (compost) this year
ANZBP members can review these statistics on a state by state level and explore the other insights gained in this and previous surveys here.